

Pacific Exchange Rates Report for September 29 - October 3
- Oct 6, 2025
- 2 min read
By: Patrick Gorman, The Quinnipiac University Global Economics Research Team
Pacific Currencies Index

Source: Eurostat and own calculations. Exchange rates are inverted to be USD per local currency (i.e., an increase indicates a stronger domestic currency) and then indexed to be 100 at the start of the period.
For the week of September 29th – October 3rd, there were similar performances among the Australian Dollar (green) and the New Zealand Dollar (blue). The Japanese Yen (maroon) slowly declined to start the week, and after a sharp decrease in the middle of the week, it ended the week around 1.5% weaker. The South Korean Won (red) declined to start the week as well, but it slowly recovered and ended around .3% weaker. While all the currencies declined in the beginning of the week, the Yen decreased the most, with the Yen decreasing by 1.5%. By the end of the week, all the currencies were slightly weaker than the USD than they were at the beginning of the week.
Pacific Historical Trends
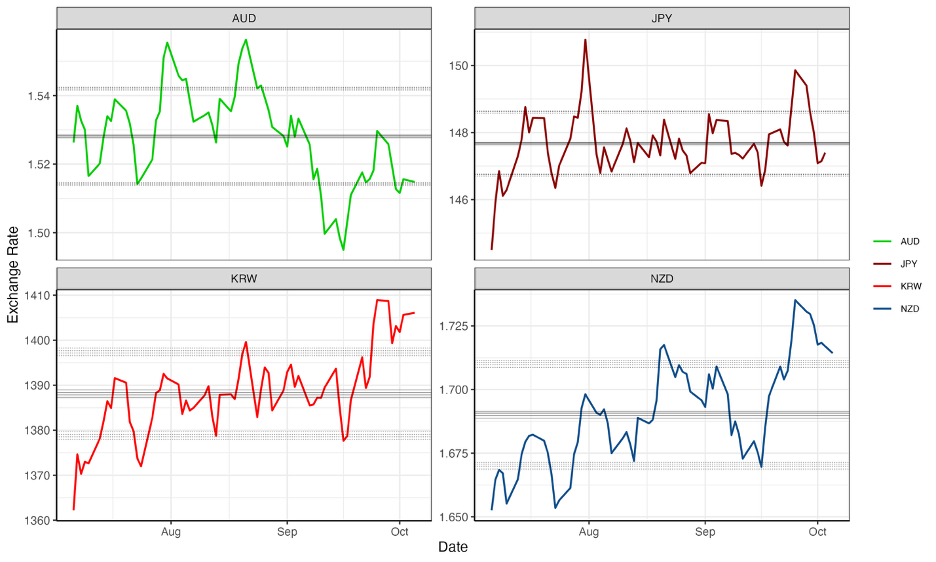
Source: Eurostat and own calculations. Exchange rates are inverted to be USD per local currency (i.e., an increase indicates a stronger domestic currency. The center line is a rolling three-month average. The upper and lower boundaries are the average plus and average minus one standard deviation, respectively, for the same three-month period.
For the week of September 29th – October 3rd, the South Korean Won (KRW) and the New Zealand Dollar (NZD) have witnessed similar changes, with steep increases at the end of September. However, the Australian Dollar (AUD) had a large decrease in early September and fluctuated up and down for the rest of the month. The Japanese Yen also fluctuated throughout the month of September and in the end remained about the same it was for August.


Comments